In this tutorial, we will walk through the process of developing a custom Prometheus Exporter in Python. Specifically, we will create an exporter to monitor an API endpoint and expose selected data as Prometheus metrics.
Please note that this tutorial will get you started with building your own Prometheus Exporters. However, the example provided in this article is simplified for the sake of understanding.
Prerequisites
- Python 3 (This tutorial uses Python 3.11)
Understanding Prometheus Exporters
Prometheus Exporters are designated endpoints from which the Prometheus server gathers metrics.
For instance, If you want to monitor a MySQL database, you can configure the MySQL Exporter to make MySQL performance metrics available to Prometheus for collection.
While a wide variety of Prometheus Exporters are readily available online, there may be a time when you need to build your own Exporter to monitor a unique application. This article is designed to guide you through that exact process.
Installing Required Python Packages
For this guide, we will utilize the prometheus-client Python package and the requests module for HTTP calls. You can install them with pip3:
pip3 install prometheus-client requestsBuilding the Prometheus Exporter Step by Step
In this tutorial, we aim to create an Exporter that persistently tracks the status of Google Cloud services. It achieves this by fetching incident data from their status API endpoint and subsequently presenting that information as Prometheus metrics.
This API endpoint returns a JSON document detailing any ongoing incidents with Google Cloud services.
Let's break down the process of creating the exporter into clear, manageable steps.
Step 1: Importing Modules and Setting Constants
First, import the required modules and define any constants:
from prometheus_client import start_http_server, Gauge
import requests
import time

GC_INCIDENT_STATUS_URL = "https://status.cloud.google.com/incidents.json"
We've imported the prometheus_client, the requests library for making HTTP requests, and the time modules for adding sleep intervals. We also set a constant for the Google Cloud Status API endpoint.
Step 2: Defining Prometheus Metrics
Next, define the Prometheus metrics that will be used to expose our data. Here, we are using Gauge which represents a number that can go up and down.
There are many types of metrics like Counter, Info, Summary, and so on that you can use. See the documentation for more details.
gc_incidents_count = Gauge('gc_incidents_count', 'Number of active incidents')
gc_incidents_gauge = Gauge('gc_incidents', 'GC incidents details', ["id", "service_name", "external_desc", "begin", "severity"])
We've defined two gauges. The gc_incidents_count gauge will hold the total number of active incidents, and the gc_incidents_gauge gauge will expose the details of each incident using the labels we defined in it.
Step 3: Fetching Data and Setting Metric Values
Create a function to fetch data from the Google Cloud Status API and set the metric values accordingly:
def set_gc_incidents_metrics():
    response = requests.get(GC_INCIDENT_STATUS_URL)

    if response.status_code != 200:
        print("Error: Unable to fetch data from Google Cloud Status API")
        return

    incidents = response.json()

    # Set total incidents count
    gc_incidents_count.set(len(incidents))

    # Set incidents details
    for incident in incidents:
        gc_incidents_gauge.labels(
            id=incident.get('id'),
            service_name=incident.get('service_name'),
            external_desc=incident.get('external_desc'),
            begin=incident.get('begin'),
            severity=incident.get('severity')
        ).set(1)
In this function, we make an HTTP GET request to the Google Cloud Status API, parse the JSON response, and set our Prometheus metrics based on the data received. Error handling is included to deal with potential issues in fetching the data.
We are assigning a value of 1 to the gc_incidents_gauge Gauge because our primary focus is on capturing the details of each incident through labels, rather than quantifying the incidents themselves. In Prometheus, a Gauge requires a numerical value, and by setting it to 1, we effectively represent each unique incident as an individual entity within the metric.
Step 4: Exposing the Metrics
Finally, initialize the HTTP server to expose the metrics and continuously update them:
if __name__ == '__main__':
    # Start up the server to expose the metrics.
    start_http_server(9099)
    print("Exporter running at http://localhost:9099")

    # Call the set_gc_incidents_metrics every 60 seconds, indefintely
    while True:
        set_gc_incidents_metrics()
        time.sleep(60)
The start_http_server(9099) function initiates an HTTP server on port 9099, which exposes the Prometheus metrics defined in the script. This is crucial for allowing the Prometheus server to scrape the metrics.
With the infinite while loop, we establish an unending cycle that continues to call our set_gc_incidents_metrics() function indefinitely at 60-second intervals. This consistent repetition ensures our metrics are regularly updated.
Here is the complete code:
from prometheus_client import start_http_server, Gauge
import requests
import time

GC_INCIDENT_STATUS_URL = "https://status.cloud.google.com/incidents.json"

gc_incidents_count = Gauge('gc_incidents_count', 'Number of active incidents')
gc_incidents_gauge = Gauge('gc_incidents', 'GC incidents details',
                                     ["id", "service_name", "external_desc", "begin", "severity"])
def set_gc_incidents_metrics():
    response = requests.get(GC_INCIDENT_STATUS_URL)

    if response.status_code != 200:
        print("Error: Unable to fetch data from Google Cloud Status API")
        return

    incidents = response.json()

    # Set total incidents count
    gc_incidents_count.set(len(incidents))

    # Set incidents details
    for incident in incidents:
        gc_incidents_gauge.labels(
            id=incident.get('id'),
            service_name=incident.get('service_name'),
            external_desc=incident.get('external_desc'),
            begin=incident.get('begin'),
            severity=incident.get('severity')
        ).set(1)

if __name__ == '__main__':
    # Start up the server to expose the metrics.
    start_http_server(9099)
    print("Exporter running at http://localhost:9099")

    # Call the set_gc_incidents_metrics every 60 seconds, indefintely
    while True:
        set_gc_incidents_metrics()
        time.sleep(60)
By running this script, you start an HTTP server on port 9099, and the exporter will continuously update the metrics every 60 seconds.
Running the script
For the sake of simplicity, I'm only running it without configuring this as a service. In a production server, you may run this script using a service manager like systemctl.
Simply run:
python3 custom_exporter.pyTesting
To ensure your exporter is functioning correctly, you can access http://localhost:9099/metrics in your web browser or use tools like curl. You should see your metrics.
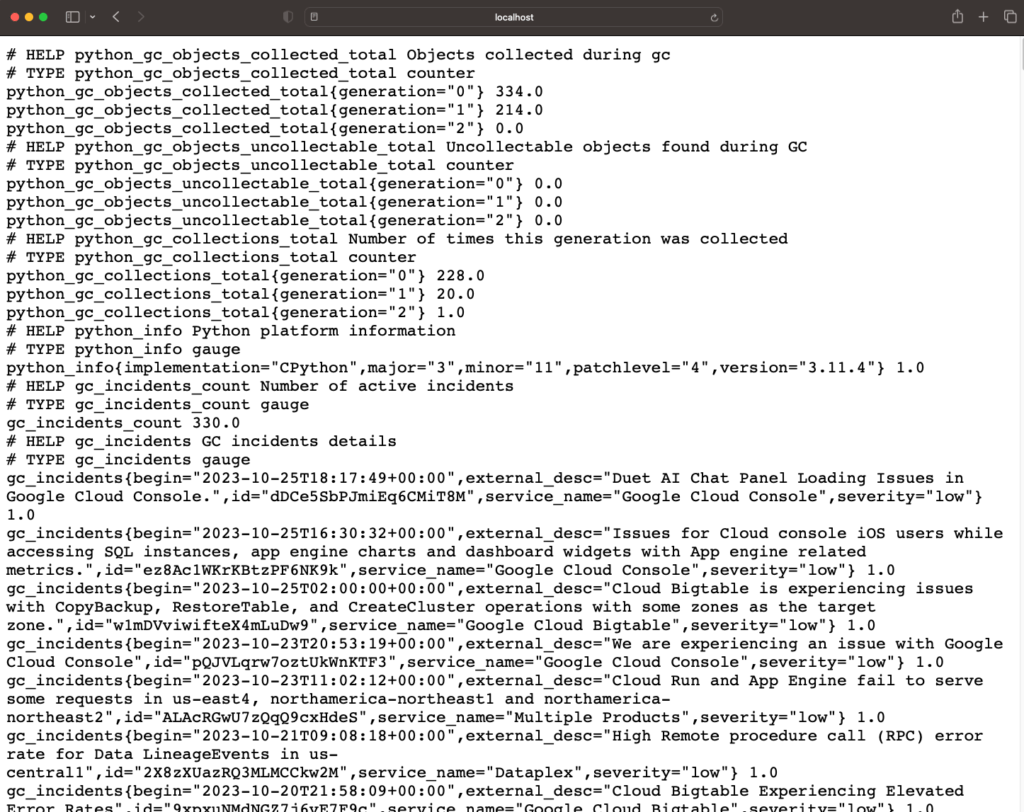
Note: The first few lines of the output are the native Python metrics and you should see the custom metrics below them.
Next Step
Now that you have your own Prometheus Exporter, you can add this exporter as a target to your Prometheus server and you can query its metrics.
Conclusion
Congratulations! You have successfully created a custom Prometheus exporter in Python. This exporter can now be integrated into your Prometheus monitoring setup, serving as a target for metric collection.
For further learning, the official Prometheus documentation and the Prometheus Python Client library documentation are excellent resources.